")
")
")

Understanding Support and Resistance in Trading
Many traders first learn the concept of support and resistance – often using the English terms directly – in the context of forex trading. In reality, however, support and resistance zones are among the most fundamental concepts in technical analysis and can be observed in nearly all financial markets.
Whether stocks and indices, commodities or cryptocurrencies – prices often react around certain levels. These areas are referred to as support or resistance.
Traders use such zones to identify potential entry or exit points or to better understand market movements. Strategies such as swing trading often rely on these price zones.
In practice, support and resistance are also frequently used to define stop-loss and take-profit levels. A detailed explanation of these concepts can be found in our article about Stop Loss and Take Profit in trading.
What are support and resistance in trading?
Support refers to a price level where a falling market often encounters buying interest. In this area, demand for an asset tends to increase, which can temporarily stabilize the price.
Resistance, on the other hand, describes a price level where rising prices frequently meet selling pressure. As a result, an upward trend may slow down or even reverse.
These zones usually develop around price areas where the market has reacted multiple times in the past. Traders monitor these levels closely because they may provide indications of potential changes in market direction.
It is important to note that support and resistance rarely represent a single precise line. In practice, they usually form price zones or areas where market participants react.
Why do prices react at support and resistance levels?
Reactions at support and resistance zones can largely be explained by the behavior of market participants.
If a price has turned upward several times at a certain level in the past, traders often remember this level or recognize it in the chart. When the market returns to this area, some investors may consider it an attractive entry point.
The opposite often applies to resistance levels. If a market has previously failed several times at a certain level, traders may be more inclined to take profits or open new short positions there, which can create downward pressure on prices.
Another factor is market psychology. Many participants pay attention to round price levels or clearly visible chart levels. As a result, buy and sell orders often accumulate in the same areas.
This interaction between supply, demand and market psychology can cause prices to repeatedly react at certain zones.
Example from the forex market
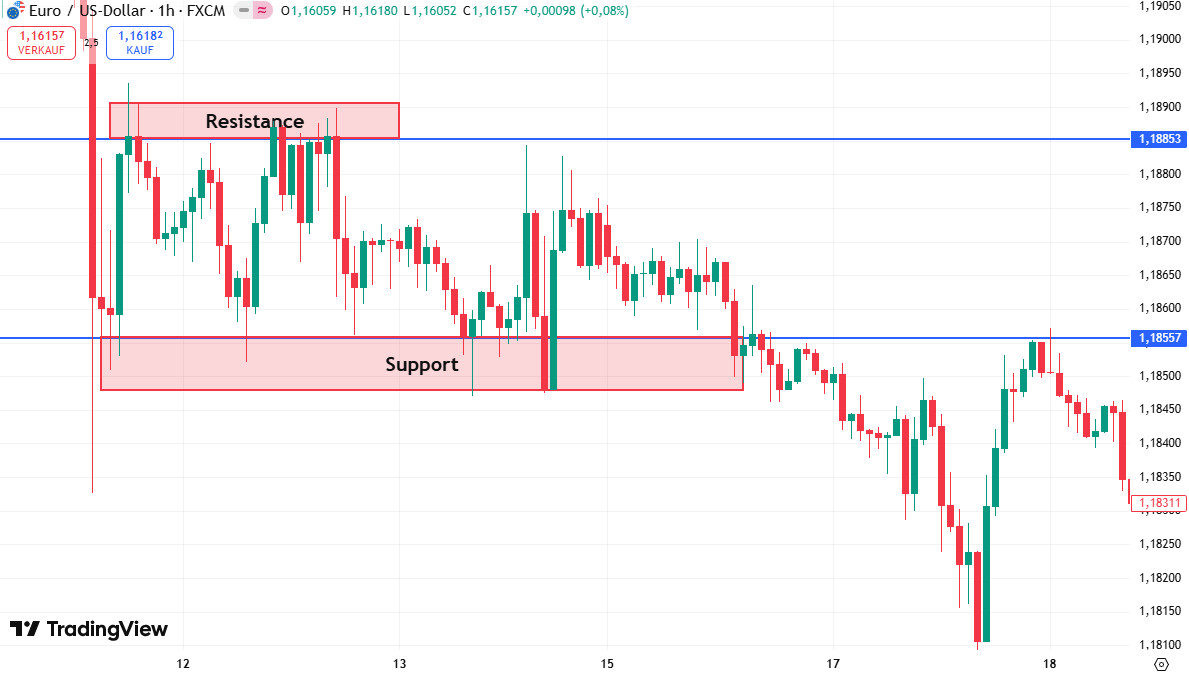
A commonly observed example of support and resistance zones can be found in the EUR/USD currency pair.
Assume that the price falls several times into a specific area and repeatedly turns upward from there. Traders may interpret this zone as support, because buying interest appears to emerge at that level.
If the price subsequently rises to a higher level multiple times and repeatedly moves lower from there, this area may be considered resistance.
Strategies such as swing trading typically aim to take advantage of these recurring market movements. Traders observe whether prices reverse within these zones or whether a breakout above an important level occurs.
Support and resistance zones do not guarantee future price movements, as they only reflect past and current market behavior. However, they can help traders better understand market structure and evaluate possible scenarios in a chart.
Another commonly observed aspect is that broken support or resistance levels may later change their role. When resistance is clearly broken, it can later act as support – and vice versa.
The following chart illustrates this behavior on the right side.
How to identify support and resistance zones in a chart
Support and resistance zones can often be identified directly in a chart. Traders typically focus on price areas where the market has reversed several times.
- Multiple price reactions: If a price repeatedly reverses around a similar level, a relevant zone may form.
- Previous highs and lows: Significant historical highs or lows often serve as reference points for future support or resistance.
- Consolidation areas: If a market has moved within a narrow range for an extended period, this zone may later act as support or resistance.
Many traders draw these areas as horizontal lines or zones on their charts. However, it is important not to treat these levels as exact points. Markets often react slightly above or below the drawn levels.
Although support and resistance zones are widely used in trading, many beginners make similar mistakes when interpreting them.
Common mistakes when trading support and resistance
- Viewing zones as exact lines: In reality, prices rarely react precisely at a single line. Support and resistance should therefore be interpreted as price areas.
- Drawing too many lines on the chart: Too many levels can quickly make a chart difficult to read. In most cases, only a few key zones are truly relevant.
- Ignoring the market trend: A strong trend can break support or resistance more easily. These levels should therefore always be analyzed in the context of the overall market trend.
- Not waiting for confirmation: A level alone is only an initial indication. For trading decisions, traders usually combine it with at least one additional indicator, such as the stochastic oscillator.
- Poor stop-loss placement: Some traders place stop-loss levels too close to obvious support or resistance zones. As a result, the market may briefly trigger these levels before moving back in the original direction.